


Charts for Github app for iPhone and iPad
4.6 (
5296 ratings )
Business
Productivity
Developer: Todd Munnik
1.99 USD
Current version: 1.4, last update: 7 years agoFirst release : 03 Sep 2016
App size: 24.47 Mb
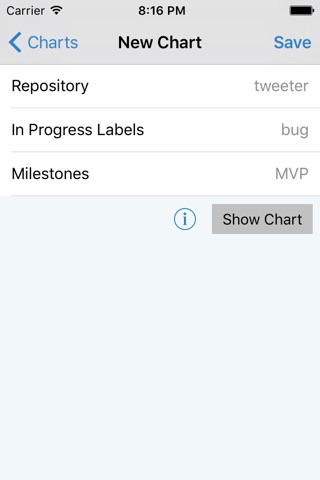
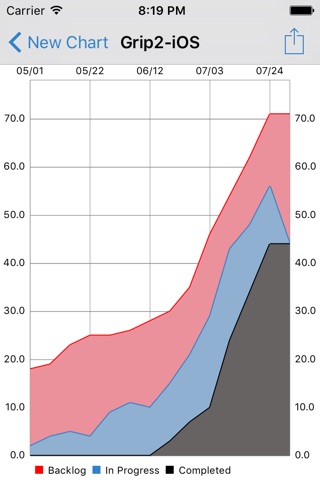
Charts for Github generates a continuous flow diagram from a Github repositorys issues. The diagram displays 3 calculations - Backlog, In Progress and Completed - per week over the past 3 months. The diagram is calculated for one repository using labels and milestones to further define and filter the chart. The chart can be exported as an image to your camera roll.
A Github user account with accessible repositories are required to log in and use the app. Charts for Github has access to your public and private repositories. Charts for Github selects a list repositories, labels, milestones and label history through Githubs API as the authenticated user.